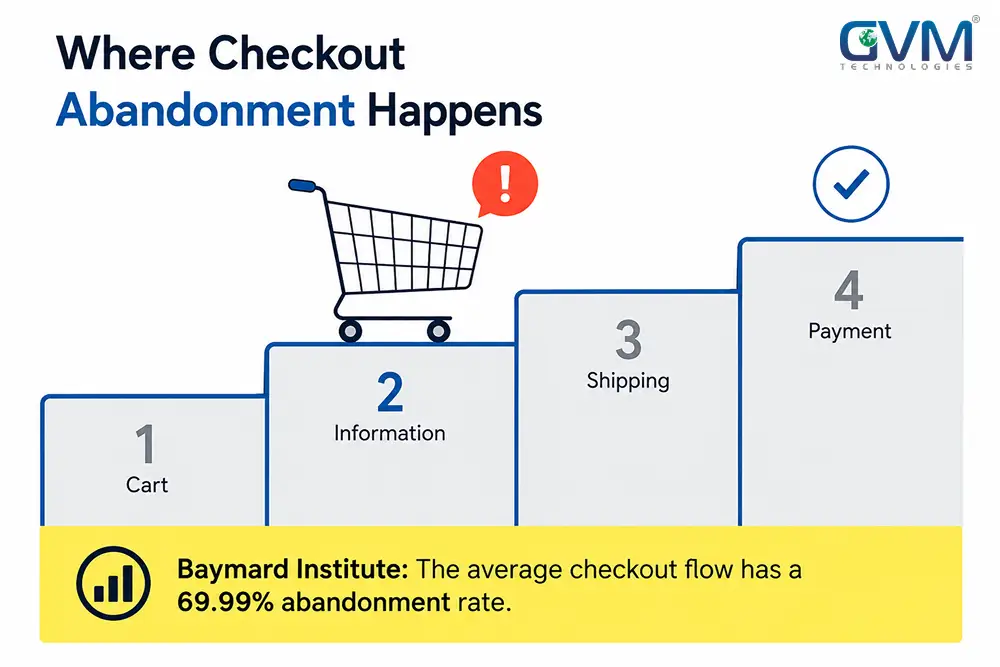
A shopping cart stalled midway through checkout, representing where and why checkout abandonment happens
Quick Answer: Checkout abandonment isn’t solved with a bigger discount. It gets solved by removing the specific moments that make a paying-ready shopper stop trusting the page, the kind of gap a proper checkout UX build is designed to catch before launch.
Baymard Institute’s 2026 tracking puts average cart abandonment at 70.22%. Most of that loss traces back to three separate causes: cost shock, checkout friction, and late-stage trust doubt, plus a few technical mechanics almost nobody audits.
Key Takeaways
- Baymard’s 2026 tracking shows a 70.22% average cart abandonment rate. Your own checkout-to-purchase ratio matters more.
- Cost shock (shipping, tax, fees revealed late) drives roughly 48% of documented abandonments, more than the next two causes combined.
- Some “abandoned checkout” data is a measurement artifact: duplicate tracking events, bot sessions, or add-to-cart clicks that were never purchase intent.
- 3D Secure payment redirects break mobile checkout in ways that look like a trust problem but need a different fix entirely.
- Realistic recovery through email, SMS, and outreach lands between 10% and 35% of abandoners.
- Shopify’s hosted checkout below Plus hides page-level analytics, so diagnosis starts one step earlier, in the cart and product page.
What Checkout Abandonment Actually Means
Most store owners use “cart abandonment” and “checkout abandonment” interchangeably. That habit alone causes wasted fixes, since the two failures happen at different funnel stages.
1. Cart Abandonment vs. Checkout Abandonment
Cart abandonment means a product got added and checkout never began. Checkout abandonment means checkout began, sometimes with a name and email typed in, and still ended in a closed tab.
Checkout Abandonment Rate = (Checkouts Started minus Checkouts Completed) divided by Checkouts Started, times 100.
| Funnel stage | What it measures | Typical driver |
|---|---|---|
| Cart abandonment | Added to cart, checkout never started | Browsing, price comparison |
| Checkout abandonment | Checkout started, not finished | Cost shock, friction, trust doubt |
| Checkout-to-purchase | Share of checkout starters who finish | The number worth tracking weekly |
2. What a Normal Rate Looks Like in 2026
Baymard’s 70.22% figure is a cart-stage average that hasn’t moved much in a decade.
A $50 impulse store and a $500 considered-purchase store shouldn’t share a benchmark. Many DTC stores see 20% to 40% checkout-to-purchase completion once low-intent browsing sessions are stripped out.
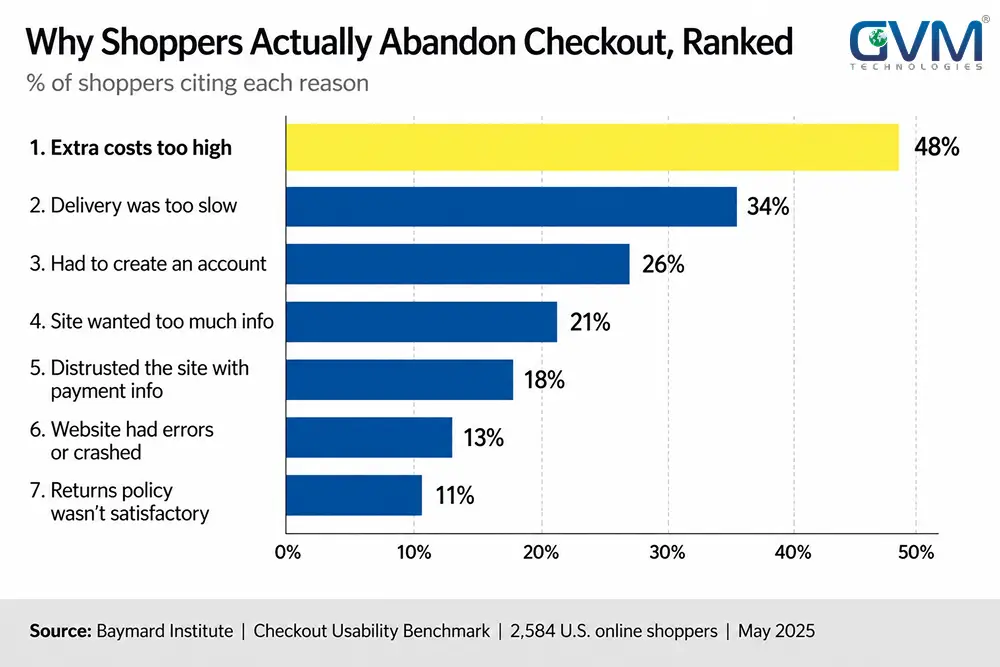
Why Shoppers Actually Abandon Checkout, Ranked
Baymard’s checkout research, built from thousands of recorded sessions, keeps ranking the same causes. Wording shifts by year; the order rarely does.
| Rank | Cause | Approx. share |
|---|---|---|
| 1 | Extra costs too high (shipping, tax, fees) | ~48% |
| 2 | Site required account creation | ~24% |
| 3 | Delivery too slow | ~22% |
| 4 | Checkout too long or complicated | ~18% |
| 5 | Didn’t trust site with card details | ~17% |
| 6 | Couldn’t see total cost up front | ~16% |
| 7 | Preferred payment method missing | ~9% |
Three patterns sit behind that table, and each needs its own fix, not one shared one.
- Cost shock isn’t about paying for shipping. It’s about discovering the fee in the final five seconds, so show the real total early.
- Trust collapse is the most misread pattern. A shopper who starts typing then leaves isn’t distracted; something specific broke their confidence.
- Friction taxes patience quietly. Forced accounts and missing payment options cost completions without ever throwing an error.
Why this matters more than it looks: A shopper who typed their email before leaving is your highest-intent lead, not your coldest one. That gap between “typed something” and “paid” is where most recoverable revenue sits, and it’s rarely a pricing problem.
The Checkout Mechanics Most Guides Never Mention
Most articles on this topic repeat the same five causes above. Four mechanics rarely get named, and each one causes real abandonment on its own.
1. Inventory Locks Create False “Sold Out” Moments
Most checkout systems place a short, platform-defined hold on stock once payment begins.
If checkout stalls past that window during a traffic spike, other shoppers can see “sold out” for stock that isn’t actually gone. Slow page response is often what causes that stall, a mechanism our website speed and conversion rate breakdown covers in depth.
2. The Payment Redirect Problem Behind 3D Secure Failures
Strong Customer Authentication under EU and UK card rules often redirects a shopper to their bank’s own verification screen mid-payment.
On mobile, that hop can bounce into a banking app and fail to return. The broken cart that results looks like a trust problem in your data, but it’s really a technical handoff failure.
3. Your Abandonment Rate Might Be a Measurement Bug
The begin_checkout event most analytics tools rely on can fire more than once per session, triggered by a back button click or a cached page reload.
Each duplicate inflates the denominator your abandonment rate is built on. Cross-checking unique checkout starts against raw event counts is a five-minute audit most stores skip entirely.
4. Not Every “Abandoned” Cart Was Ever Meant to Convert Today
Two separate behaviors hide inside that one label:
- A real share of shoppers use “add to cart” the way they’d use a wishlist, especially on stores with no saved-items feature.
- Inconsistent product photography, polished studio shots next to mismatched lifestyle images, can read as a reseller storefront, and that doubt tends to surface at checkout, not on the product page where the image lives.

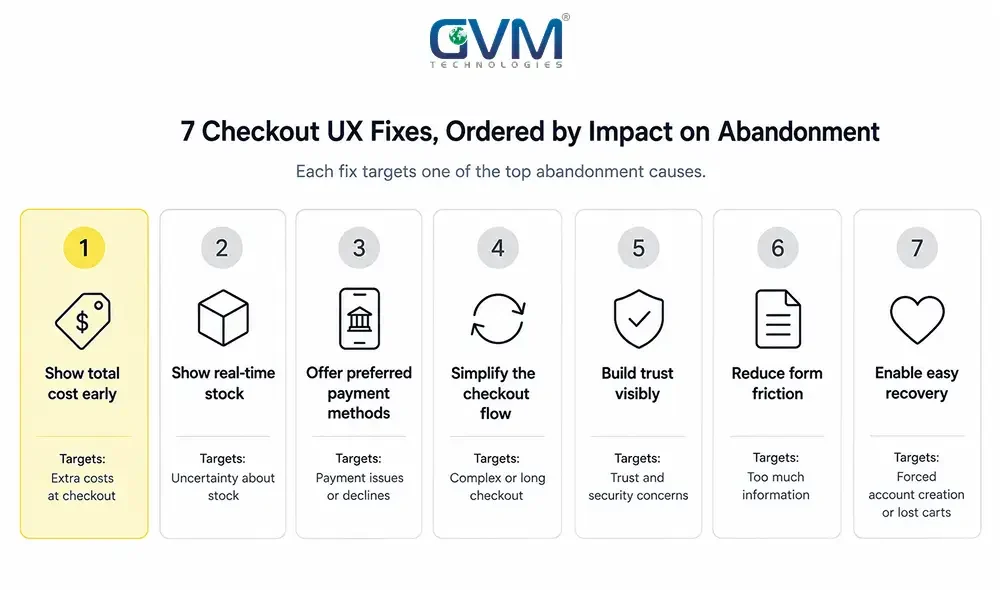
The UX Fixes That Actually Move the Needle
These seven map directly to the ranked causes above, roughly in the order most stores should tackle them.
- Show the real total before checkout begins. Add shipping estimates and tax to the cart page, not just the final screen.
- Make guest checkout the default. Offer account creation after the order confirms, never before, on any platform including a custom-built storefront.
- Add a visible progress indicator. “Step 2 of 3” reduces perceived length even when step count stays the same.
- Fix the empty discount code field. An unused promo box sends shoppers hunting for a code on another tab, and many never return.
- Surface buy-now-pay-later on the product page. “$500 or 4 payments of $125” changes the mental math before add-to-cart ever happens.
- Rebuild trust in the final thirty seconds. A specific returns line and a real review count above the payment button beat the same elements in a footer.
- Treat mobile checkout as its own audit. Blending mobile and desktop data hides exactly where the real leak sits.
Diagnosing Your Funnel Before You Touch Anything
Redesigning checkout without diagnosing it first is how stores rebuild a page that was never the actual leak.
- Split cart abandonment, checkout abandonment, and checkout-to-purchase into three separate numbers.
- Watch at least twenty recorded checkout sessions before changing a field or button.
- Filter bot and scripted traffic out first. A technical SEO and traffic audit should run before any UX budget gets approved.
If you run Shopify below Plus, this step matters more. The hosted checkout is a black box by design, so diagnosis has to happen one step earlier, in the cart and product page.
| Symptom in session recordings | Likely cause | Fix |
|---|---|---|
| Exits right after shipping cost appears | Cost shock | Show the real total early |
| Starts typing, pauses, then leaves | Trust collapse | Rebuild trust near the payment button |
| Rage-clicks a form field repeatedly | Friction or a broken field | Progress indicator, mobile audit |
| Returns to cart, total is now higher | Tax or discount recalculation bug | Technical QA on checkout logic |
Recovery Tactics That Realistically Bring Carts Back
Prevention beats recovery, but no checkout hits 100% completion.
| Channel | Effort | Typical recovery share | Best for |
|---|---|---|---|
| Email (1hr, 24hr, 72hr sequence) | Low | Baseline of the mix | Every store |
| SMS (opted-in only) | Medium | Adds meaningfully on top of email | Mobile-heavy audiences |
| Direct outreach or call | High | Small volume, highest value | High-AOV or B2B carts |
Store operators who track this seriously land recovery between 10% and 35% of abandoned checkouts. The range depends on timing, personalization, and order value.
A lifecycle marketing strategy built around this channel mix, not one flow sent to everyone, is what separates 10% recovery from 30%.
Capturing form inputs before submit is a real recovery tactic. It’s also a genuine GDPR consent question, not a gray area to route around quietly.
Disclose it in your privacy policy, and gate it behind the same consent flow as your marketing cookies.
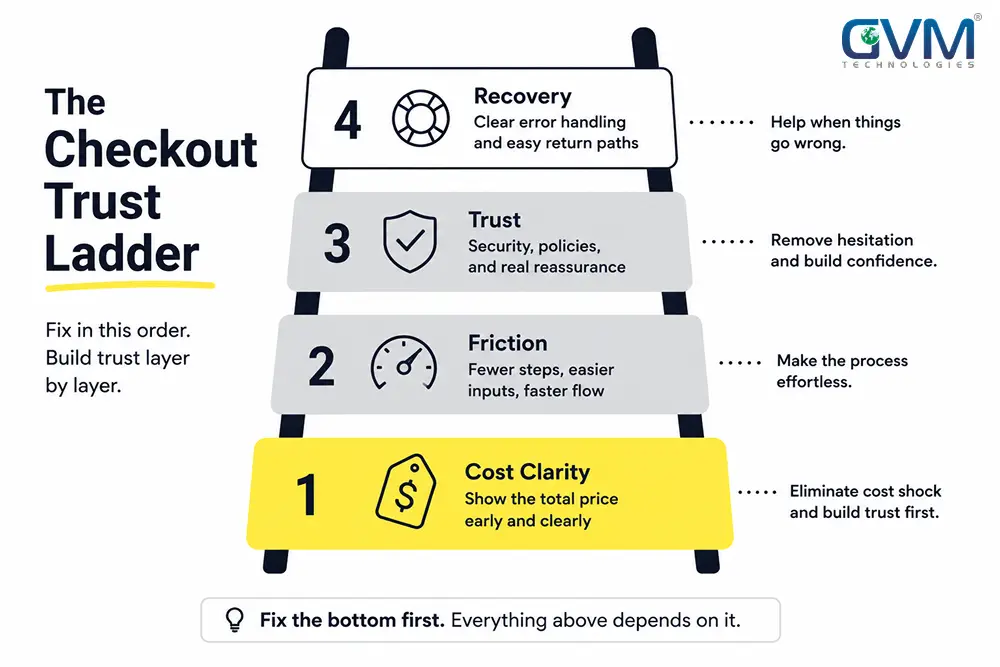
The Checkout Trust Ladder Framework
Most checkout audits produce a long, unranked list of suggestions.
The Checkout Trust Ladder fixes that. It maps each layer to the cause it addresses, in the order Baymard’s data says to tackle them.
| Layer | Fixes | Core action |
|---|---|---|
| 1. Cost Clarity | The ~48% citing cost shock | Show shipping and tax before the final screen |
| 2. Friction Removal | The ~24 to 18% lost to forms and accounts | Guest checkout default, progress indicator |
| 3. Trust Confirmation | The ~17 to 16% who doubt the site late | Specific returns copy, real reviews |
| 4. Recovery Safety Net | Whatever layers 1 to 3 miss | Segmented email and SMS, session recordings |
Work top to bottom. A recovery safety net built before cost clarity is fixed just catches the same leak over and over.
Five Mistakes That Quietly Undo Good Checkout Fixes
- Optimizing before checking whether the traffic was real. A redesign aimed at bot sessions changes nothing measurable.
- Treating cart and checkout abandonment as one problem. They need separate reports and separate fixes.
- Adding a discount popup instead of fixing cost shock. A coupon papers over distrust; it doesn’t resolve it.
- Leaving an empty promo field live with no active promotion. It sends buyers away to search for a code that doesn’t exist.
- Never separating mobile checkout data from desktop. Fixing a desktop-only issue while mobile, usually the majority of traffic, keeps leaking.
FAQs
1. What is a good checkout abandonment rate?
There’s no single healthy number, since it depends on price point and traffic source. A 20% to 40% checkout-to-purchase completion rate is common for many DTC stores.
2. Why do customers abandon checkout right after entering payment details?
This is usually a late-stage trust break, not distraction. A vague returns policy or a payment redirect that suddenly feels risky can cause someone to leave after they’ve already started typing card details.
3. Does free shipping alone reduce checkout abandonment?
It helps with cost shock, roughly half of documented abandonments, but won’t fix friction or trust on its own. A small lift after adding free shipping usually means a second cause is still unaddressed.
4. How much of my abandoned checkout data is bot traffic or a tracking error?
There’s no fixed share, but stores with heavy retargeting often find real overlap between bots, duplicate begin_checkout events, and wishlist-style add-to-cart clicks. Audit traffic before any UX redesign.
5. Can a 3D Secure payment redirect cause checkout abandonment?
Yes. A failed bank-app handoff during Strong Customer Authentication leaves a broken checkout that looks like a trust problem but is a technical one, and testing the redirect on real phones is the fix.
6. What’s a realistic recovery rate from abandoned checkout emails and SMS?
Most stores that track this carefully recover between 10% and 35% of abandoners, depending on timing, personalization, and order value.
Conclusion: Where to Start This Week
Checkout abandonment isn’t one problem with one fix. It’s cost shock, friction, trust, and a handful of overlooked technical mechanics acting as separate leaks, each needing its own diagnosis first.
- Split cart abandonment from checkout abandonment, and confirm which stage is actually leaking.
- Run the Checkout Trust Ladder against your funnel, starting at Layer 1.
- Watch twenty real checkout sessions, and rule out measurement bugs, before changing a single field.
Not sure whether your checkout needs a UX pass, a platform rebuild, or QA testing to catch what’s silently breaking conversions?
GVM Technologies has audited and rebuilt checkout flows for ecommerce brands since 2012, including the ecommerce SEO work behind GlobalRose.
Book a checkout audit with GVM Technologies and get a funnel-by-funnel breakdown of what’s actually costing you sales.