


Quick Answer: Below roughly 1,000 sessions or 50 conversions a week, standard A/B testing with low traffic rarely reaches statistical significance in a usable timeframe. A technical SEO audit usually shows whether that’s a traffic problem or a page problem first.
The fix isn’t a better testing tool. Pick one high-impact change, test it directionally over a fixed 2 to 4 week window, measure a micro-conversion instead of the final sale, and pair it with fast qualitative research.
Key Takeaways
- “Low traffic” ranges from 5 to 10 conversions a week to 5,000 weekly visitors, depending on the source. Page type decides which applies to you.
- A 5% relative lift on a 3% conversion rate needs roughly 210,000 visitors per variation. A 20% relative lift on the same rate needs closer to 1,100.
- Stopping a test early because it “looks” significant pushes your false-positive rate from 5% up to 20 to 30%.
- Research-backed hypotheses win more often. One CRO team’s own data showed an 80% win rate on research-driven tests, against 60% overall.
- The average landing page converts at 2.35%. Check your number against that before assuming a test will fix anything.
Most site owners hit this wall the same way: traffic is seasonal or thin, and every guide assumes volume they don’t have.
Running a test that needs six months of data on a product that sells for ten weeks a year won’t finish. It just burns ad spend proving nothing.
What Counts as “Low Traffic” for A/B Testing?
There’s no single agreed number. VWO puts the floor at 5 to 10 conversions a week; other CRO teams use 5,000 weekly visitors and 500 weekly conversions. Both are right for different testing ambitions.
What matters more is the page you’re changing:
| Page type | Directional testing | A “proper” statistical test |
|---|---|---|
| Pricing / checkout | ~1,000 sessions/month | ~3,000 to 5,000/month |
| Product or service page | ~1,500 sessions/month | ~4,000 to 6,000/month |
| Homepage | ~2,000 sessions/month | ~6,000 to 8,000+/month |
| Blog / lead-magnet CTA | ~2,500 sessions/month | ~8,000+/month |
Below the left column, don’t run a test yet. Read on for what to do instead. The role analytics plays at this stage is diagnosis, not experimentation.
Why Your Test Isn’t Reaching Statistical Significance
Every test chases a Minimum Detectable Effect (MDE): the smallest lift worth detecting, at 95% confidence and 80% power. Smaller MDEs need dramatically more traffic.
| Baseline rate | Lift to detect | Sample size needed |
|---|---|---|
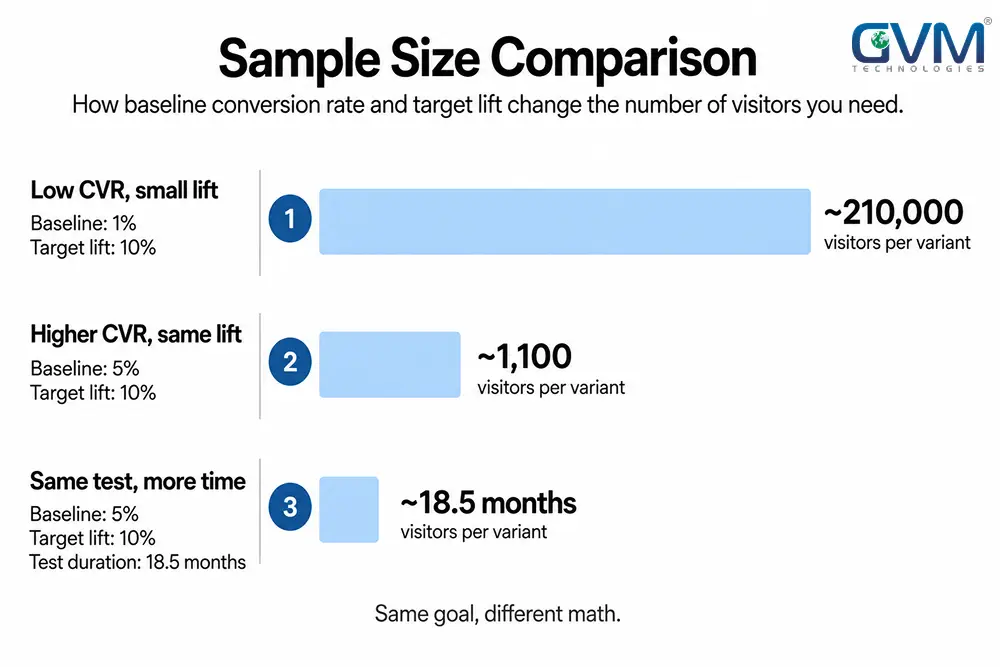
| 3% | 5% relative | ~210,000 visitors per variation |
| 5% | 20% relative | ~1,100 visitors per variation |
| 2.5%, at 800 visits/month | 20% relative | ~18.5 months per variant |
A 5% relative lift on a 3% baseline means detecting a difference of roughly one visitor in 700. No tool fixes that math.
Chase a 20 to 30% lift instead, and the required sample drops by an order of magnitude.
How Much Traffic You Actually Need, by Tier
Instead of asking “do I have enough traffic,” ask what your traffic tier allows:
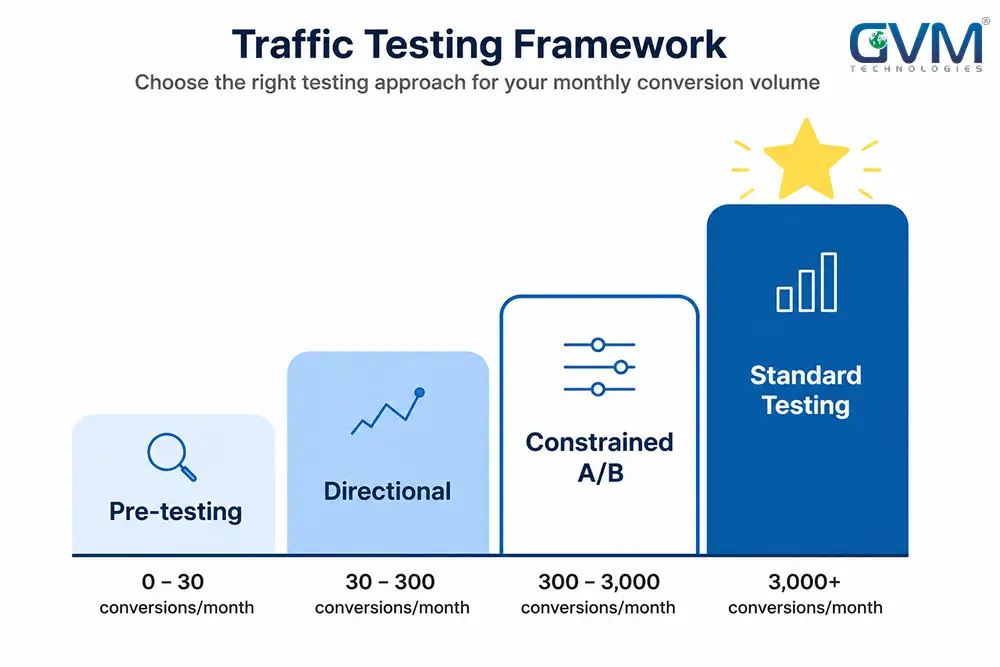
| Tier | Monthly conversions | What testing looks like |
|---|---|---|
| Pre-testing | Under 50 | Skip formal testing. Fix friction, run interviews, build traffic. |
| Directional | 50 to 300 | One big lever, sequential, fixed 2 to 4 week windows. |
| Constrained A/B | 300 to 1,000 | Real split test, one page, one challenger, 20%+ MDE only. |
| Standard testing | 1,000+ | Full split testing, tighter MDEs, multivariate viable. |
Most small businesses and early-stage products spend their first year or two in the first two tiers. That’s the expected starting point, not a failure.
What to Test First When Traffic Is Low
Skip micro-tweaks. Button color and font weight move conversion by fractions of a percent, exactly the effect size that needs the biggest samples.
Put limited traffic behind changes that could move the needle 15%+ instead:
- Offer framing and headline: biggest lever, roughly 10 to 50% impact potential
- Primary call-to-action wording: roughly 10 to 40%
- Form length: cutting fields, roughly 15 to 50%
- Trust signals near the CTA: reviews, guarantees, roughly 10 to 30%
Test one lever at a time, sequentially rather than simultaneously. Run variant A this month, variant B next month.
Hold price and ad spend flat between the two. That doubles the sample each version gets, at the cost of speed you didn’t have anyway.
Cap every test at two variations. Multivariate testing needs roughly four times the traffic of a simple test, so save it for the standard-testing tier.
Get the page’s UX fundamentals right before testing on top of them. A confusing layout will drown out any variant you run.
Test Clicks Before You Test Conversions
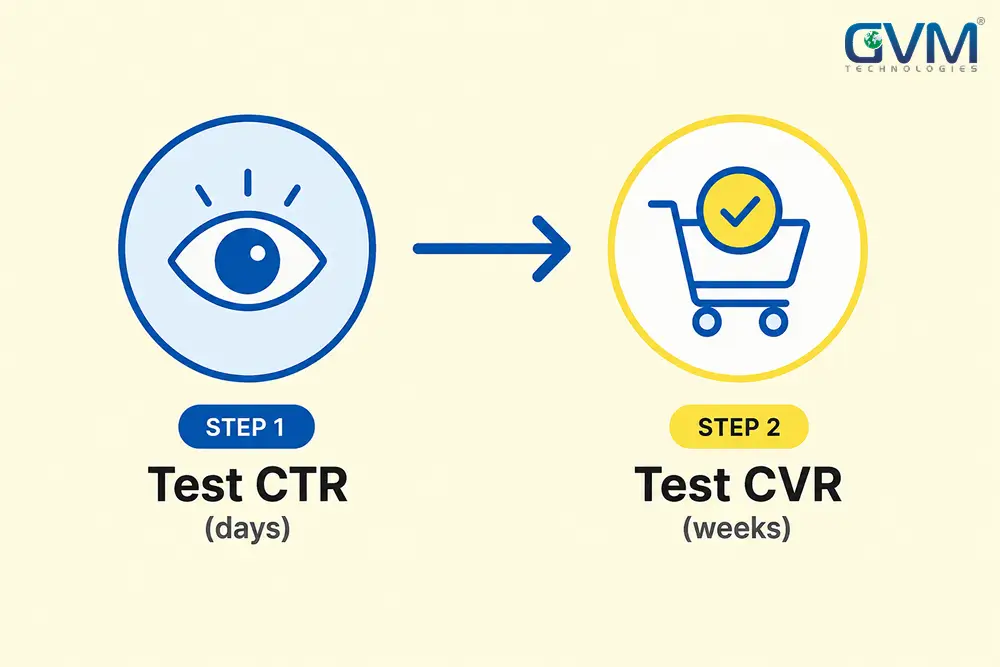
Impression and click data arrives 10 to 100 times faster than conversion data, because far more people see and click something than complete a purchase. Use that gap:
- Test headline, thumbnail, or ad copy through Google Ads or Meta Ads first. Both report clicks within days.
- Compare click-through rate once impressions clear a few thousand.
- Only carry the CTR winner into your slower, more traffic-hungry on-page test.
This means your conversion test only ever runs on a version that’s already proven it earns attention. Strong ad and landing page copy is what makes this step work.
How to Read Results Without “Statistical Significance”
| Statistical A/B test | Directional test | |
|---|---|---|
| Split | Simultaneous | Sequential: one variant, then the other |
| Stopping rule | Fixed sample size, no peeking | Fixed 2 to 4 week window |
| Confidence | 90 to 95%+ | “Likely better,” not proven |
| Best for | High traffic, small lifts | Low traffic, big lifts |
Set a guardrail metric before you start. If you’re shortening a checkout form, track refund rate alongside completions, so a “win” isn’t quietly a loss elsewhere.
Measure engagement close to the action, not several steps downstream. The closer the metric sits to the actual change, the less noise dilutes the signal.
Segment results only after you’ve called a winner, never while the test is still live. Slicing by device mid-test is how random noise gets mistaken for a pattern.
When You Should Skip A/B Testing Completely
Below the directional-testing threshold, the highest-return move isn’t a test:
- Find the drop-off point. Free analytics shows exactly where people leave.
- Ask the people who almost converted. One exit-intent question beats a month of thin test data.
- Fix what’s obviously broken. Missing pricing or a buried contact form doesn’t need a test to justify fixing.
- Apply proven best practices. Fewer form fields and visible social proof already have the evidence behind them.
Five one-on-one user sessions typically surface 80 to 85% of a page’s usability problems, according to Nielsen Norman Group’s original research. That curve flattens fast, so the fifth conversation matters more than the fiftieth.
Is Your Conversion Rate Actually Bad?
Check your numbers against real benchmarks before assuming a test will fix anything:
| Metric | Typical benchmark |
|---|---|
| Average landing page conversion rate | ~2.35% |
| Top 10% of landing pages | ~11.45% |
| Average cart abandonment | ~70% |
| Visitors who leave a page loading 3+ seconds | ~40% |
If your numbers sit near the bottom, you may have a speed or trust problem, not a testing problem. See how page speed impacts conversion rate before running anything else.
Tools That Work Even With Low Traffic
Match the tool to your tier. Don’t buy an enterprise suite before you have enterprise traffic.
| Category | Use it for |
|---|---|
| Heatmaps / session recordings | Useful with a few dozen sessions |
| Exit-intent survey | A handful of responses is actionable |
| Free web analytics | Confirms where the funnel leaks |
| Split-testing platform (VWO, Optimizely) | Worth the cost only past 300 monthly conversions |
A solid website development foundation, with clean analytics and fast pages, is what makes every tactic above actually measurable.
Mistakes That Waste the Traffic You Do Have
- Running more than one variant against control
- Changing several elements and calling it one test
- Stopping the moment a result “looks” significant
- Testing micro-tweaks instead of high-impact changes
- Ignoring seasonality or a competitor’s campaign skewing the window
- Testing your favorite page instead of your highest-traffic one
- Running a test with no guardrail metric
- Reading a brand-new design’s early spike as a real win, when novelty fades within days
When You’re Finally Ready for Real A/B Testing
Once your page clears 3,000 to 8,000 monthly sessions and the site hits 1,000+ monthly conversions, standard testing at 95% confidence becomes practical.
Two things usually need to happen first, and neither is a testing problem: more qualified traffic through SEO, keyword strategy, and AI search visibility; and tracking accurate enough to trust.
Conclusion
A/B testing with low traffic is not a smaller version of standard testing. It’s a different discipline built on bigger changes, shorter feedback loops, and qualitative research doing the work statistics can’t do yet.
Being stuck in an early tier is not a failure. It’s the stage every growing site passes through before volume catches up, and the framework above tells you exactly what to do at each stage instead of guessing.
Pick your current tier, run the one tactic that matches it, and check your numbers again in four weeks. That single habit beats almost every “proper” A/B test a low-traffic site could attempt.
Frequently Asked Questions
1. How many visitors do I need for A/B testing?
It depends on your baseline conversion rate and target lift. Under 1,000 monthly sessions, skip formal testing for qualitative research; between 1,000 and 8,000, use directional testing; above that, run standard A/B tests.
2. Can I A/B test with 100 visitors a month?
Not reliably. Even a real difference between versions looks like noise at that volume. Use exit surveys and heatmaps instead, and revisit testing once you’re above a few hundred monthly conversions.
3. What is a Minimum Detectable Effect?
The smallest improvement worth detecting, like a 20% relative lift. Smaller targets need dramatically bigger samples, which is why low-traffic sites should chase big, obvious changes.
4. Is Bayesian testing better than standard A/B testing for small sites?
It generally reaches a usable answer with less data, since it estimates the probability B beats A instead of requiring 95% confidence. It still needs real traffic; it narrows the gap, not removes it.
5. How long should a low-traffic test run?
At least one to two weeks, ideally a full 2 to 4 week window covering a complete weekday and weekend cycle.
6. What if my traffic is seasonal, not just low?
Run directional tests during your actual selling window, comparing like-for-like periods from the same season where possible, instead of forcing a statistical test into a peak that won’t repeat until next year.
Talk to GVM About Turning Limited Traffic Into Reliable Growth
Every tactic above assumes two things most small sites don’t have yet: enough traffic to test with, and tracking accurate enough to trust.
GVM Technologies builds both. SEO and digital marketing grow real traffic, and the website development work makes your analytics trustworthy in the first place.
As an ISO-certified team (27001:2022, 20000-1:2018, 9001:2015) with development and marketing under one roof, every recommendation ties back to leads and revenue you can verify. GlobalRose’s e-commerce SEO campaign shows that approach in practice.
Talk to GVM about your growth strategy and find out whether your traffic ceiling is a testing problem or a visibility problem, before you spend another month waiting on a test that was never going to finish.
 Call us : +1 (786) 947-6105