


Quick Answer: Website speed and conversion rate move together. Every added second of load time removes a visitor before they see your offer.
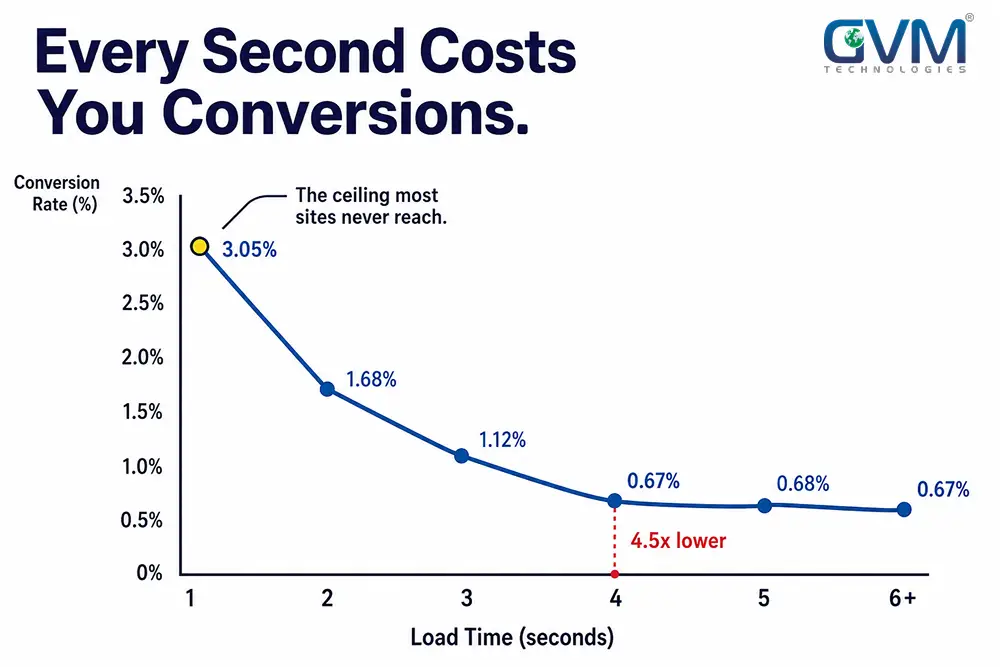
Portent’s dataset of roughly 100 million page views shows exactly how much: e-commerce conversion rate falls from 3.05% at 1 second to 0.67% at 4 seconds.
Fix server response time and your largest image first. A technical SEO audit confirms which one is actually costing you sales.
Key Takeaways
- Conversion rate drops hardest in the first 1 to 4 seconds, then flattens. The first second you recover matters more than the fifth.
- Vodafone gained 8% more sales from a 31% LCP improvement. TUI cut bounce rate 31% by making pages 78% faster.
- Only 48% of mobile sites pass all three Core Web Vitals at once, per the HTTP Archive’s 2025 Web Almanac.
- TTFB’s real “good” threshold is 800 milliseconds, not 200. Many guides confuse this with the INP threshold.
- Server response time and your largest image usually cause more delay than every plugin, font, and script combined.
- Speed fixes are necessary, not sufficient. One documented site went from 10 seconds to 3 with no conversion change, because the offer was the real bottleneck.
Why Website Speed Drives Conversion Rate
Speed doesn’t lower conversion rate through some indirect ranking effect. It works directly, in the browser, through three mechanisms.
Abandonment. PayPal’s own research found 40% of visitors abandon a site that hasn’t loaded within 3 seconds. That loss concentrates on product and checkout pages, not the homepage, since paid and search traffic land there first.
Trust discount. A page that stutters or jumps reads as less credible than one that feels instant, even when the real load time is similar. Attention spans on a single screen have dropped from roughly 2.5 minutes in 2004 to under a minute today, shrinking the window a page has to prove itself.
Invisible churn. A visitor who bounces off a slow page doesn’t complain. They open a new tab and land on a competitor instead. That means a genuinely slow site can bleed revenue for months with no obvious signal in analytics, because the people it lost were never counted as “engaged” in the first place.
The Real Data Behind Website Speed and Conversion Rate
Portent’s research is the most rigorous public dataset on this question: 5.6 million sessions, 20 websites, roughly 100 million page views.
| Load time | E-commerce conversion rate |
|---|---|
| 1 second | 3.05% |
| 2 seconds | ~2.0% |
| 4 seconds | 0.67% |
| 6+ seconds | Well under 0.67% |
B2B lead-generation pages held up better between 1 and 4 seconds before falling off past 6. A slow contact form doesn’t just lose someone in the moment; it teaches them not to trust the same site with a payment later.
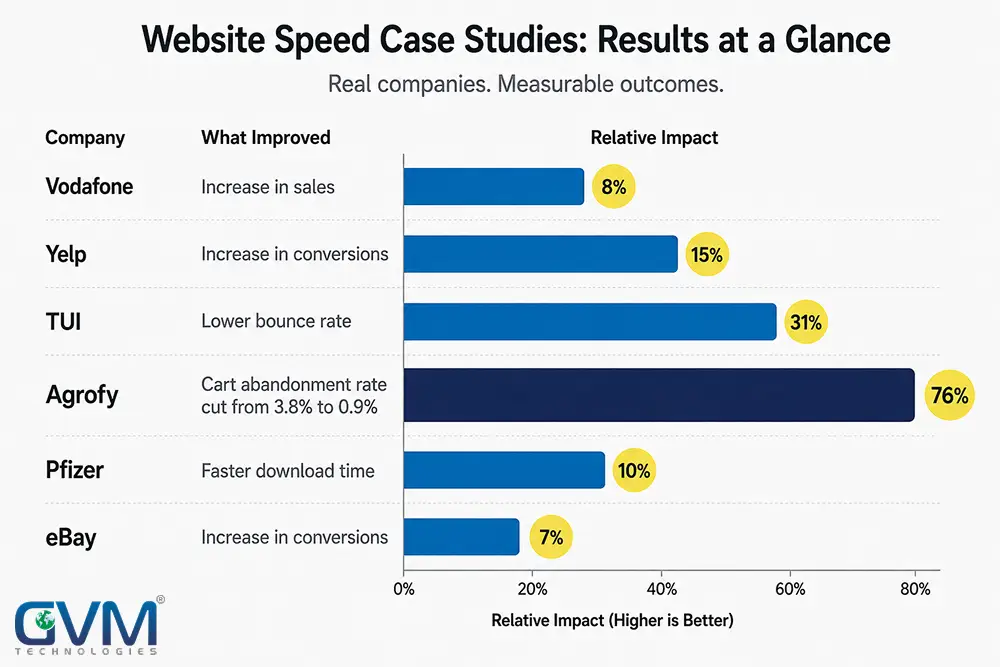
Named case studies make the pattern harder to dismiss, all documented in Google’s own page speed research:
| Company | What changed | Result |
|---|---|---|
| Vodafone | LCP improved 31% | 8% more sales |
| Yelp | Fixed a 3s-to-6s regression | 15% more conversions |
| TUI | Load time cut 78% | 31% lower bounce rate |
| Pfizer | Load time cut 38% | 20% lower bounce rate |
| Agrofy | Site-wide performance pass | Cart abandonment: 3.8% to 0.9% |
| eBay | Pages made 12% faster | 0.5% more add-to-cart |
Each row pairs one engineering change with one tracked outcome. That pairing is what makes a speed claim worth building a budget around.
The Website Speed Statistics Trap
Search “website speed statistics 2026” and dozens of roundups surface, most citing precise-sounding numbers that don’t survive a cross-check. Two widely shared “2026” pages disagree by nearly double on the same metric: one puts average mobile load time at 8.6 seconds, another at 3.6 seconds, and neither links to a checkable dataset.
The famous “100ms delay costs 1% of revenue” line has the same problem. It traces back to an early Amazon anecdote with no published methodology, repeated as gospel through posts that never cite a primary source.
Before quoting any speed stat, check four things:
- Does it name the company, study, or dataset?
- Can you trace it to an original source?
- Is a sample size mentioned?
- Does it hold up next to your own analytics?
Portent’s dataset and the named case studies above pass all four, which is why they carry more weight than the generic percentages recycled everywhere else.
Core Web Vitals and TTFB, Correctly Explained
1. The Three Metrics That Matter
| Metric | Measures | Good threshold |
|---|---|---|
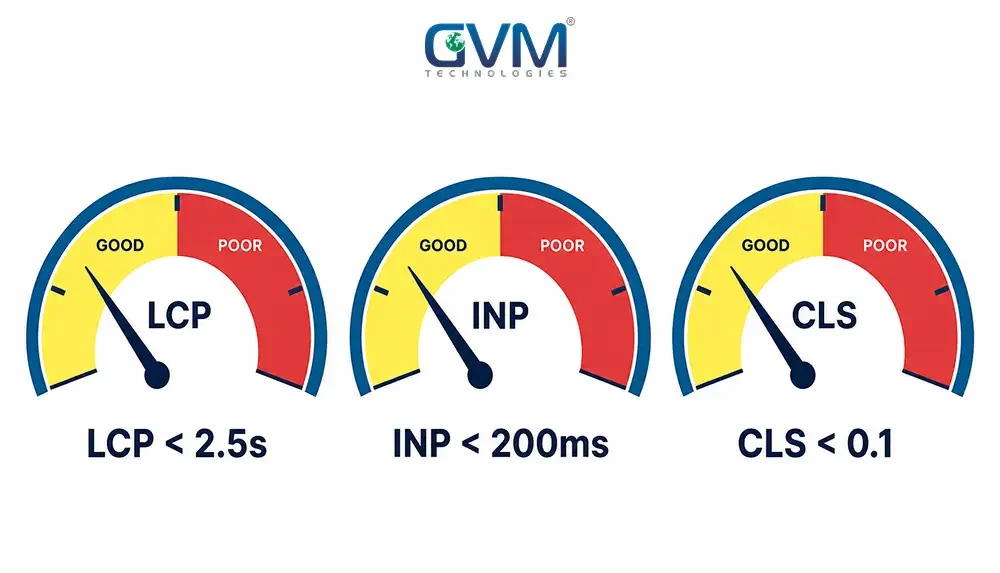
| LCP | Time until the biggest visible element renders | Under 2.5s |
| INP | How fast the page responds to a click or tap | Under 200ms |
| CLS | How much content shifts while loading | Under 0.1 |
INP replaced FID as the third Core Web Vital in March 2024. Guides still centered on FID predate that change. Only 48% of mobile sites pass all three at once, per the HTTP Archive’s 2025 Web Almanac.
TTFB isn’t an official vital, but it gates every other metric. Google’s published threshold is 800 milliseconds, not 200. That 200ms figure many guides repeat is actually the INP number, and chasing it wastes budget on infrastructure a site doesn’t need.
2. Lab Data vs. Real User Data
PageSpeed Insights shows two data sets, and conflating them is a common mistake:
- Lab data: one simulated test on a throttled connection
- Field data: real visits from real devices, via the Chrome UX Report (CrUX), over 28 days
A site can score 95 in lab data and still show a “poor” LCP in field data. Field data is closer to what’s actually shaping your conversion rate.
The Fix-First Stack: What to Actually Prioritize
Most audits return 20 to 40 recommendations, rarely in the right order. Fixing this in the order below beats chasing a Lighthouse score.
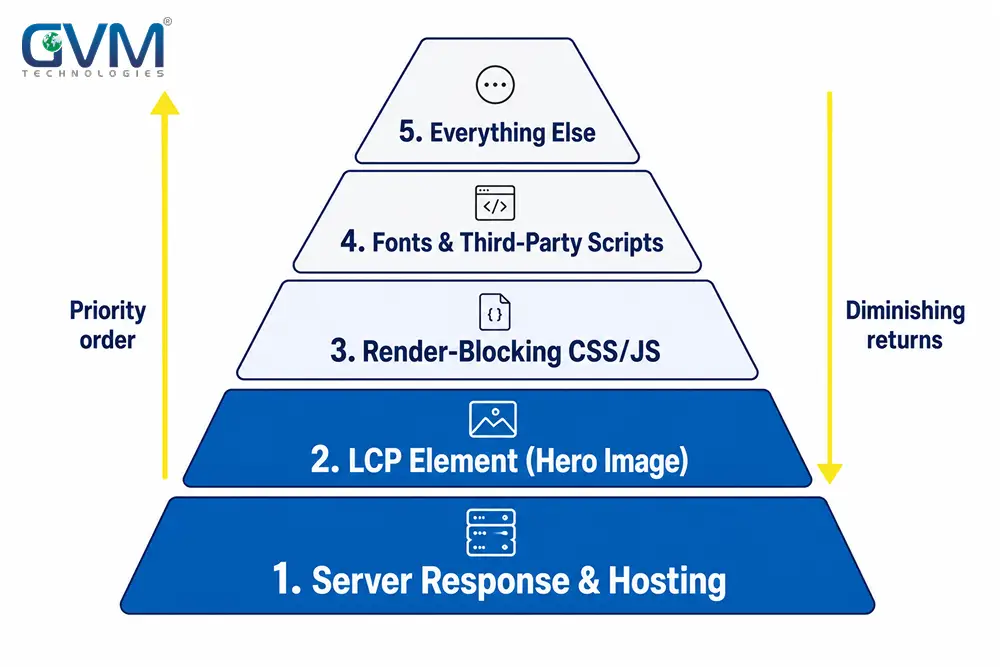
1. Server Response and Hosting Location
This is an infrastructure problem, not a code one. The most common cause is geography: the server sits in one country while traffic originates in another. Moving hosting closer to visitors, or adding a CDN, is usually a same-week fix.
Signs this is your bottleneck:
- TTFB consistently above 800ms in field data
- Server hosted in a different country than most traffic
- LCP still failing after the hero image is already compressed
2. Your Largest Contentful Paint Element
Find whatever renders as the LCP element and fix that asset first. An unoptimized 3-4MB hero image, often a raw phone-camera upload, is the most common cause of a failing LCP score.
- Resize to actual display dimensions, not the 4000px original
- Convert to WebP or AVIF and compress it
- Preload the LCP image instead of letting it compete for bandwidth
3. Render-Blocking CSS and JavaScript
Heavy page builders ship styling for every layout option, not just the one your page uses. Defer non-critical JavaScript, inline critical CSS, and remove unused plugins.
Uninstalling a plugin doesn’t always remove its leftover CSS or JavaScript, and that orphaned code keeps dragging on render-blocking scores.
Some older guides still recommend splitting assets across subdomains for parallel downloads. That’s outdated HTTP/1.1-era advice; HTTP/2 and HTTP/3 multiplex over one connection, so sharding usually adds overhead instead of removing it.
4. Fonts and Third-Party Scripts
Custom fonts, chat widgets, and tracking pixels are individually small but numerous. Set font-display: swap so text renders in a fallback font while the custom one loads, and audit every third-party script for whether it’s earning its place.
Desktop and mobile versions of the same site often behave like different codebases in practice, since mobile devices run identical scripts with far less processing power.
5. Everything Else
Lazy-loading, further minification, and minor layout-shift fixes matter only once Layers 1-4 are solid. Pushing a score from 91 to 98 rarely moves conversion rate once a site already loads fast on a mid-range phone.
When to stop: Once a site loads in roughly 2 to 2.5 seconds on mobile over real cellular data, further speed work has a shrinking return. The next dollar usually does more in the offer or checkout flow.
Fix the Page That Makes You Money
A homepage speed audit is the default starting point for most agencies, and it’s frequently wrong. Paid traffic, search traffic, and email land on product and checkout pages, not the homepage.
Pull up analytics and test the page carrying the most conversion value, on mobile, before touching a homepage almost nobody converts on directly.
A performance budget, a hard ceiling on page size or LCP time, keeps a fixed page from quietly regressing every time someone adds a new banner or script.
Running new pages through quality assurance testing against that ceiling before launch catches regressions early.
Mistakes That Waste a Speed Budget
- Mistaking a high PageSpeed score for a fast site. The score is a lab proxy; check field data before trusting it.
- Treating speed fixes as a subscription. Compressing an image or fixing hosting has a clear endpoint, not an ongoing retainer.
- Optimizing desktop and assuming mobile follows. A 1.5-second desktop page can still be a 6-second page on LTE.
- Assuming speed alone guarantees conversions. One documented site cut load time from 10 seconds to 3 with zero movement in rankings or conversions, because targeting and offer were the real constraint. Speed raises the ceiling; it doesn’t guarantee the floor.
Speed also matters unevenly by industry. PayPal’s data puts average load time for automotive and travel sites near 6-7 seconds, both well above target, yet both convert plenty of buyers, because high-consideration purchases tolerate friction that an impulse purchase won’t.
How to Diagnose Your Site First
- Run PageSpeed Insights on your highest-traffic landing page, and read field data before the lab score.
- Check the mobile score specifically; it’s usually worse than desktop.
- Load the same page on a real phone over cellular data, not office Wi-Fi.
- Compare mobile versus desktop conversion rate in your own analytics.
- Identify the exact LCP element before assuming the fix needs a developer.
A site consistently over 4-5 seconds on mobile is worth a proper case study review before another dollar goes anywhere else in the budget.
FAQs
1. Does website speed really affect conversion rate?
Yes. Portent’s dataset, 5.6 million sessions and roughly 100 million page views, confirms conversion rate drops sharply past the first couple of seconds, then flattens.
2. What’s a good page load time in 2026?
LCP under 2.5 seconds on a real mid-range phone over cellular data. That’s where Portent’s conversion data starts to flatten.
3. Does page speed affect SEO rankings, or just conversion rate?
Both, but not equally. Google treats Core Web Vitals as a tiebreaker, not a major ranking factor. The conversion impact is larger and more direct.
4. How much does it cost to fix?
It depends on the layer. A hosting fix and hero image compression can resolve in days. A heavy page builder with dozens of plugins may need a rebuild; website development costs is a reasonable starting comparison.
5. Will fixing speed guarantee more sales?
No. Speed removes a friction point that caps conversion, but it doesn’t fix a weak offer or unclear messaging. Treat it as raising the ceiling, not a guaranteed floor.
6. What’s the difference between TTFB and LCP?
TTFB measures how fast the server answers the first request. LCP measures how fast the largest visible element finishes rendering after that. A slow TTFB makes a good LCP score almost impossible, since LCP’s clock can’t meaningfully start until the server has responded.
The Bottom Line
Website speed and conversion rate move together because speed removes friction, and friction is what conversion rate optimization exists to eliminate. Fix server response time and the largest image first, then render-blocking code and fonts. Stop once the site loads in roughly 2 to 2.5 seconds on a real phone.
GVM Technologies runs technical audits and site rebuilds under one accountable team, so the fixes above don’t stall between three disconnected vendors.
It’s ISO-certified (27001:2022, 20000-1:2018, 9001:2015), and its SEO team works alongside the same development team that can rebuild the slow parts of a site.
See the GlobalRose case study for a comparable engagement end to end.
Book a Website Speed and Conversion Audit with GVM Technologies and get a written breakdown of exactly what to fix, in what order, and roughly what it will take.
 Call us : +1 (786) 947-6105